
Macroeconomic forecasting, in general, attempts to predict the future behaviour of the economy and identify possible turning points of the business cycle. Accurate forecasts are particularly useful for the policy and decision makers to take actions which will boost economic growth. IDEA focuses on Luxembourg and questions if there are any factors that hinder this task and presents an overview of the forecasts that have been published during the recent years. Economic forecasts are a very complex and challenging endeavour. In macroeconomics, contrary to other sciences, the researcher cannot create laboratory conditions in order to perform experiments. The conduct of economic forecasts is even more demanding and difficult for Luxembourg due to its unique features. Luxembourg has a small, dynamic economy with a high degree of openness. As a result, its performance depends on a relatively small number of sectors and it is closely interrelated to international evolutions, especially to those of its main trading partners. The high contribution of the financial sector to GDP, in particular, makes the economy vulnerable to international financial crises – at least in theory. Last but not least, the high number of crossborder workers and net migration flows make the study of the Luxembourg labour market extremely intricate.
IDEA compared the forecast accuracy, for three main macroeconomic indicators (real GDP, unemployment and inflation), of the forecasts that have been conducted by three international (European Commission, IMF, OECD) and two national institutions (BCL, STATEC). Aim of this attempt is neither to criticise nor to “stigmatise” any of the included institutions, but on the contrary to show that economic projections especially for Luxembourg, is indeed a very perplexing, challenging and puzzling task.
The initial objective was to include annual forecasts since 1999, because that was the introductory year of the euro. Unfortunately, due to data limitations, the observations are confined to the years dating from 2004 to 2014. This is a relatively short time span, during which economic activity was volatile, and consequently accurate forecasts were very difficult, to conduct. Pertinent to the volatility of economic statistics for Luxembourg are the high revisions which are routinely made in Luxembourg[1] (e.g according to the updated revisions of July, the GDP of 2007 and 2013 has been revised from 6.5% to 8.4 % and from 2% to 4.4% respectively). For objectivity reasons there has been an attempt to include forecasts that were published by these institutions at the same period of each year, and specifically during the previous year’s first semester of the year that the forecast referred to. That was not always possible because some of the institutions either didn’t publish their forecasts in the same publications or weren’t publishing their forecasts on a regular basis. In these cases, the next later available forecast has been used.
The criterion that has been applied is the widely used Root Mean Squared Error (RMSE)[2], according to which the lower the value of RMSE, the more accurate are the projections on average. RMSE is a common mean of measuring how much the forecasted value of a variable diverges from it’s actual value on average. It is also important to note that RMSE also includes the projection “errors” which may be caused, among other factors, by new government decisions, unexpected economic (or other) shocks, variations in oil prices, etc. between the time of projections and the statistical release. The realizations that have been used are the releases that are currently available after all revisions. It must be pointed out that the analysis presented here is very sensitive to the assumptions. The results might have been different if we had used forecasts published in different time periods or alternative criteria such as the Mean Absolute Error (MAE) and the Mean Absolute Percent Error (MAPE). The results of the analysis are presented below.
The presentation begins with the index that concerns directly the population, the unemployment rate. The index of unemployment which has been employed is that of the National Definition (ADEM) and is calculated as the number of unemployed persons to the total active population. The projections of European Commission have been excluded because they are based on a different definition, i.e. the one adopted by Eurostat.
Graph 1. Annual unemployment rate, projections and realizations. Table 1. Unemploment RMSEs
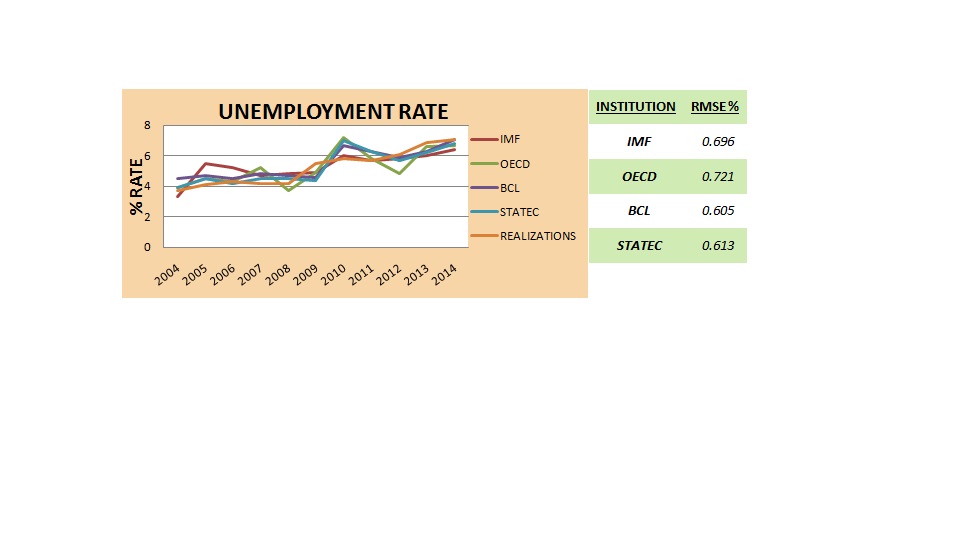
Sources: International Monetary Fund, Organisation for Economic Co-operation and Development, Central Bank of Luxembourg, STATEC. Calculations: IDEA.
Graph 1 illustrates the institutions forecasts and actual values of the unemployment rate while table 1 represents the corresponding RMSEs. As it can be seen from the graph, the institution forecasts are almost aligned, meaning that their forecasts do not differ to a large extent. Also the actual unemployment rate (orange line) remains relatively stable from 2004 to 2008 at around 4%, but onwards increased quite substantially. Note that the BCL and STATEC lines are closer to the realizations line, as proven by the calculated RMSEs of these institutions which are the two lowest and almost identical (0.605 and 0.613 respectively).
Graph 2. Real GDP annual growth, projections and realizations. Table 2. Real GDP RMSEs
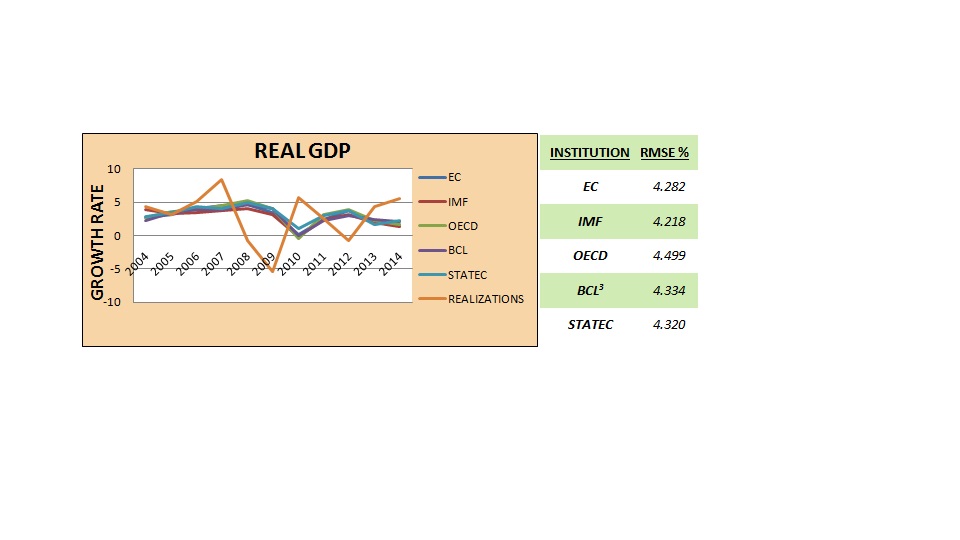
Sources: European Commission, International Monetary Fund, Organisation for Economic Co-operation and Development, Central Bank of Luxembourg, STATEC. Calculations: IDEA.
Graph 2 shows the forecasts and realizations of the most discussed index, GDP. This graph has two distinct characteristics. First, there is a great alignment of the forecasts, as the lines almost coincide. Second, there are some “spikes” of the actual values. Specifically, in 2007 the real GPD growth was almost double to the most “favorable” forecast, as this realised GDP growth reached 8.4%. In 2009 by contrast, there was a great depression due to the economic and financial crisis, which was predicted by no institution. Forecasts regarding the years 2008, 2009 and 2012 were to the opposite direction of the actual movements of GDP. Generally, the calculated RMSEs are relatively close to one another, but those of the IMF and EC are slightly lower than the others, meaning they are closest to reality in the observed timeframe.
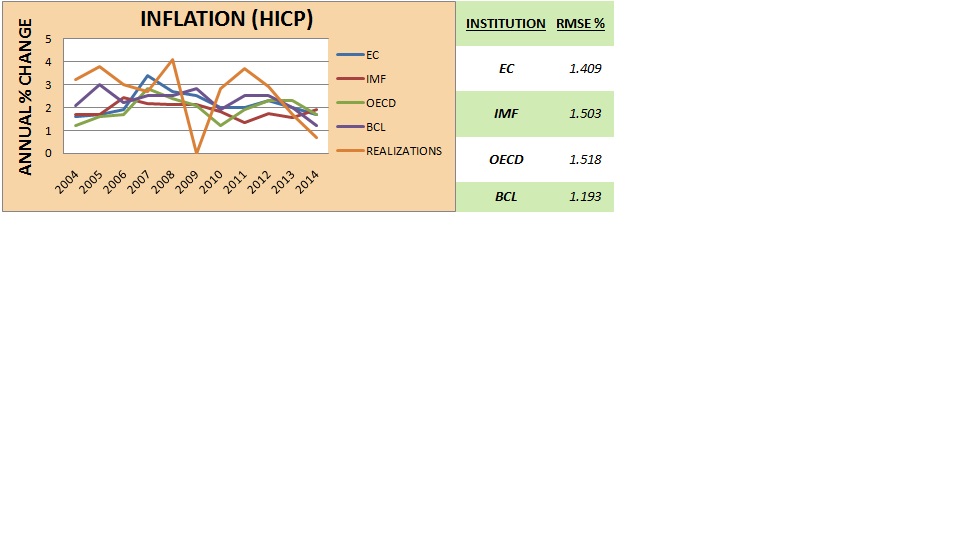
Graph 3. Harmonised Index of Consumer Prices annual % change, projections and realizations. Table 3. HICP RMSEs
 Sources: European Commission, International Monetary Fund, Organisation for Economic Co-operation and Development, Central Bank of Luxembourg, STATEC. Calculations: IDEA.
The indicator that interests the “average consumers” the most is inflation. It is demonstrated by graph 3 that the actual values of inflation, as measured by HICP, displayed large fluctuations. Especially in 2007 during the economic activity pickup, in 2009 during the financial crisis and during the following rebound of the economy. This reveals difficulties in forecasting the different “turning points” of inflation. The institutions’ forecasts are relatively close to one another but not as close as they were in the previous indices, as shown by the calculated RMSEs. Table 3 reveals that on average, the BCL forecasts were closer to the actual values of HICP.
BCL and STATEC have published forecasts for an alternative index of inflation, namely IPCN, the national equivalent to the harmonized HICP. The difference between HICP and IPCN is that they follow a different weighting approach (the HICP puts much more emphasis on energy prices and it therefore tends to be more volatile). The calculated RMSEs are 0.975 for BCL and 1.120 for STATEC, implying that their projection accuracy is very close on average.
The analysis that has been presented here may serve as a starting point for a discussion, while the conclusion that can be extrapolated, is that economic forecasts are indeed a very demanding, complex and intricate job. The actual data show high fluctuations of real GDP and HICP and a unemployment increase after 2008. It seems difficult to rate one single institution as the “top performer” , but in most cases the published projections are quite close one another. However, it is inevitable that some projections will be closer to the actual values than others. What is important is the need for more robust forecasts, which would assist policy-makers and companies to take rational decisions, measures and actions which would further contribute to economic growth. This is something which may can be accomplished by a collaboration and an exchange of know-how of the involved institutions and organizations.
[1] Details that cover the period 1995-2009 can be found in the following working paper of STATEC:
http://www.statistiques.public.lu/catalogue-publications/economie-statistiques/2010/39-2010.pdf
[2] RMSE is calculated as following: RMSE=![]() , where n is the number of observations, is the projected value of a variable under consideration and θ is it’s realization.
, where n is the number of observations, is the projected value of a variable under consideration and θ is it’s realization.
[3] For the calculations of BCL’s RMSE, the arithmetic mean of the forecasted interval has been used.
Articles liés
 Réserve de compensation : le calme avant la tempête ?
- Tableau de bord économique et social – juin 2020
- Compétences : une fresque en constante évolution
- Résultats du consensus économique flash Covid19 – Juin 2020
- Tableau de bord économique et social – Mai 2020
- Compétitivité européenne : un bon « vintage » ? Participation d’IDEA à une conférence à Porto