Historically, Luxembourg has been ranked among the Euro Area (EA), European Union 28 (EU28) and OECD countries as a country with one of the lowest average retirement age[1]. For instance, the effective average retirement age for Luxembourgish males in 1999 was the second lowest and in 2012 the lowest among the OECD countries, while the same ages for Luxembourgish females were ranked respectively twelfth and fourth. Generally, at an international level there is a trend of increasing average effective retirement ages. Is Luxembourg following this trend? Will it follow in the future? At what age today’s teenagers will retire? Questions like these concern current and future working population.
Idea has developed the appropriate tools[2] to study the labor market and simulate alternative scenarios under various sets of parameters. In this blog we will study the average effective retirement ages. We will present the results of two alternative scenarios namely the” Baseline” and the “Hypothetical pension scheme change” scenario. Of course, the projections and the simulations we have performed, contain a certain amount of risk. We obtain the projections today under certain assumptions about the parameters, based on historical observations and we implicitly postulate that the assumptions will hold over a long projection horizon. There is no guarantee that any of the assumptions will last during the projection horizon if they are affected by policy changes, as well as by various exogenous and unpredictable factors.
In what follows we present a description of the data, the underlying assumptions and results of the “Baseline” and “Hypothetical pension scheme change” scenarios.
Data
We have used data from the period 1999-2013 published by Eurostat which have been obtained by the Labor Force Survey series (LFS). The data include the participation rates of the resident population in five year age groups, separately for men and women. To simplify we do not make a distinction between full and part-time workers. The participation rate shows what is the percentage of an age group active population (sum of employed and unemployed individuals but still searching actively for a job) to the total population of that age group.
Baseline scenario (“business as usual”)
The methodology is the same with that of the Ageing Working Group (AWG) Report 2015 and Burniaux, Romain and Jaumotte[3] and can be encapsulated as following: first, using past observations of the participation rates we calculate the exit rates out of the labor market and we project the future participation rates. Finally, using the obtained projections we calculate the exiting probabilities from the labor market by quinquennial age group and the average effective retirement age. It has to be stated that we do not consider the various kinds of retirement separately (disabilty,early retirement, joint and surviror etc) but as a whole.
Chart 1: Baseline scenario, probability of exiting from the labor market (retiring), per age group (x, x+4) for men and women
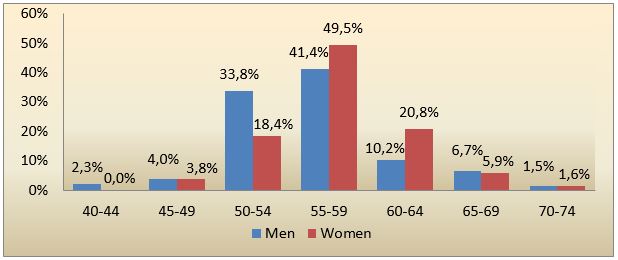 Source: Eurostat, Calculations IDEA
Chart 1 displays the probabilities of exiting from the labor market (retiring) for men and women. Obviously, the most probable age to retire for both men and women is an age between 55 and 59 of with probabilities 41.4% for men and 49.5% for women and the next most probable is an age between 50-54 for men (33.8%) and between 60-64 for women (20,8%).
Table 1: Baseline scenario, average retiring age for men and women over the projection horizon
| Gender/Year | 2020 | 2030 | 2040 | 2050 | 2060 |
| Men | 58.74 | 58.30 | 58.35 | 58.39 | 58.80 |
| Women | 59.06 | 59.64 | 59.77 | 59.89 | 60.19 |
Source: Eurostat, Calculations IDEA
Table 1 presents the projections of the effective retirement age for men and women. According to the projections the average male retirement age will fluctuate around 58.46 reaching 58.80 in 2060. The women average exit age will increase gradually and will reach from 59.06 in 2018 to 60.19 in 2060. Generally the women average exit age will remain higher than the one of men. In all years the average effective retirement age of women is slightly higher than the one of men.
Hypothetical pension scheme change
The following scenario is just for illustrative purposes. The most prominent factor which affects the retirement age is the statutory minimum age of retirement. In this scenario we assume that from 2020 and onwards the minimum retirement age will be 65 for both men and women. At the same time we assume that everyone will have retired by the age of 75. So, we set as a probability of retiring at the age of 65 the cumulative sum of the retiring probabilities for the ages [40-64] of the baseline scenario for both genders and we keep the same retiring probabilities for the age brackets [65-69] and [70-74]. We set the probability of retiring at [75-75+] equal to zero because we have assumed that everyone will have retired by the age of 75. The decision to distribute the retirement probabilities in such a manner is in congruence with the historical observation that there is a skewness towards the earliest possible retirement age.
Table 2: Hypothetical pension scheme change scenario, average retiring age for men and women over the projection horizon
| Gender/Year | 2020 | 2030 | 2040 | 2050 | 2060 |
| Men | 65.57 | 65.71 | 65.51 | 65.44 | 65.51 |
| Women | 65.45 | 65.15 | 65.36 | 65.35 | 65.38 |
Source: Eurostat, Calculations IDEA
Table 2 presents the average retirement ages under hypothetical change in pension scheme scenario. According to our projections the average retirement age for the men will fluctuate around 65.5 years for the most of the projection. Regarding the women, it is expected to be over 65, while it is projected to be 65.40 in the end of the projection horizon. Similarly to the baseline scenario, the women average effective retirement age will be higher than these of their male counterparts.
Concluding we owe an answer to the question addressed in the title. The answer is not simple. If we assume that no changes will take place in the future and that everything will remain exactly as it is today we could say that in average today’s boys will retire at the age of 58.80 while today’s girls will retire at the age of 60.19. But, these numbers are just projections and it is very likely that shifts will take place in the future regarding either changes in the participation rates or implementation of pensions reform or any exogenous factor that cannot be predicted today.
[1] Source: http://www.oecd.org/els/emp/ageingandemploymentpoliciesstatisticsonaverageeffectiveageofretirement.hm
[2]For further details: http://www.fondation-idea.lu/2015/12/02/new-jobs-needed-how-many-and-when/ and http://www.fondation-idea.lu/2015/07/08/the-one-million-luxembourg-a-global-analysis-is-needed/
[3] The 2015 Ageing Report, Underlying Assumptions and Projection Methodologies, European Economy 8|2014, http://ec.europa.eu/economy_finance/publications/european_economy/2014/pdf/ee8_en.pdf
Burniaux J., Duval R., and Jaumotte F. (2003),”Coping with ageing: a dynamic approach to quantify the impact of alternative policy options on future labour supply in OECD countries“, OECD Economic Department Working Papers, No. 371
Articles liés
 Financement de la santé : ne gaspillons pas notre « période de grâce ».
 - Idée du mois n°13 – Budget de la santé: vraiment si idyllique?
- The one million Luxembourg: a global analysis is needed
- Les jeunes sont-ils “particulièrement” touchés par le chômage au Luxembourg ?
- Série Réforme fiscale (2/5) – Prévoyance-vieillesse : un goût de « trop peu » pour les bas revenus
- Les défis du Luxembourg passés au crible de sa jeunesse