par Philippe Robin qui fut statisticien au ministère de la Culture.
« Les industries culturelles et les industries créatives sont l’avenir du Luxembourg et de l’Europe » affirmait sans détour Bob Krieps lors de sa prise de fonction à la tête de la direction du ministère de la Culture en 2010[1].Quatre années plus tard, l’importance des industries créatives ne fait aucun doute aux yeux du gouvernement luxembourgeois car elles « représentent d’ores et déjà un pourcentage important du PIB au Grand-Duché »[2].
Ces déclarations s’ajoutent aux nombreuses autres qui présentent les « Industries Culturelles et Créatives » (ICC) comme sources d’importantes retombées économiques et de compétitivité pour l’Europe, le plus souvent dénuées de toute explication et de toute référence chiffrée qui en accréditent la véracité. En effet, qu’entend-on par l’expression « Industries Culturelles et Créatives » (ICC) et quelles informations permettent d’affirmer que ces ICC représentent d’ores et déjà un secteur en devenir de l’économie luxembourgeoise ?
Si l’intérêt et les attentes que suscite aujourd’hui le secteur des Industries Culturelles et Créatives sont bien réels, il n’en demeure pas moins qu’il prévaut encore une méconnaissance statistique profonde à l’égard du secteur des ICC mais surtout du champ culturel comme l’a récemment démontré la Fondation Idea asbl à travers ses travaux655[3].
Une définition mouvante
L’expression « Industries Culturelles et Créatives » est très souvent utilisée mais trop rarement définie. S’il existe aujourd’hui un véritable consensus en Europe sur la délimitation du champ culturel et les activités qui le composent[4], les divergences sont nombreuses lorsqu’il s’agit de définir les ICC.
Depuis près de vingt ans, définition et délimitation du concept du secteur des Industries Culturelles et
Créatives font l’objet de très nombreux débats et d’interprétations divergentes dans lesquelles les notions de créativité, de capital intellectuel et de développement technologique entretiennent la confusion. On parle tout aussi bien d’industries des arts et de divertissement (Arts and entertainment industries), d’industries audiovisuelles, d’industries de la connaissance (Knowledge industries), d’industries de contenus (Content industries), d’industries de divertissement (Entertainment industries), d’industries des loisirs (Leisure industries), d’industries des médias ou d’industries du copyright (copyright industries)[5], etc. D’un point de vue strictement sectoriel, les définitions varient selon les approches retenues et les domaines d’activités qu’il est décidé d’y inclure, ce qui a pour conséquence de peser sur la mesure de l’importance économique et culturelle du secteur en question. Si certains domaines d’activités comme le cinéma, la musique ou encore le livre sont systématiquement inclus dans le périmètre du secteur, d’autres domaines font l’objet de débats permanents comme la création de mode, l’artisanat culturel, le tourisme ou encore les nouvelles technologies en raison de leur relation d’interdépendance avec les ICC[6]. On relève également des approches nationales dans lesquelles les Etats vont clairement privilégier certaines activités selon leurs traditions ou encore selon les forces en présence au sein de leur économie culturelle.
Au Luxembourg, les « Industries Culturelles et Créatives », dénommées parfois « Industries Créatives », sont définies par le cadre national des statistiques culturelles comme l’ensemble des activités culturelles qui éditent, produisent et diffusent des biens et des contenus reproductibles relevant de la propriété intellectuelle. Malgré leurs différences, les expressions « Industries culturelles » et « Industries créatives » sont souvent confondues et utilisées l’une pour l’autre. Tandis que la première regroupe les seules activités d’industries de contenus produisant des biens et des services culturels basés sur des prototypes reproductibles ainsi que les activités des industries de diffusion (livres, presse, musique, jeux vidéo, cinéma, vidéo, télévision, radio)[7], la seconde étend le périmètre du secteur étudié aux activités culturelles qui utilisent la culture comme intrant dans le processus de production de contenus et de biens non culturels (architecture, design et publicité[8].
Un secteur économique de la culture peu documenté
De plus en plus d’observateurs s’accordent à attribuer aux secteurs de la culture et de la création d’importantes retombées économiques notamment en termes d’emploi[9], néanmoins la multiplicité des définitions existantes ne permet pas aujourd’hui de travailler sur une base certaine et de disposer de statistiques comparables à l’échelle internationale. Selon les sources, le poids des Industries culturelles et créatives en Europe représente de 2,6 %[10] à 6,5 %[11] du PIB européen et varie de 5 millions à 8,5 millions en termes d’emplois[12].
Au Luxembourg, ces difficultés d’analyse se trouvent amplifiées par la rareté des données disponibles et par l’absence d’études de référence sur le secteur. Les rares données publiques sur le Luxembourg ne sont pas diffusées par le Statec mais par la Commission européenne[13]. Elles montrent que, contrairement ce que pourrait laisser croire la dénomination du secteur, les 1 500 entreprises actives dans les Industries Culturelles et Créatives sur le territoire national ne relèvent pas de l’industrie mais bien des activités de services. En 2012, ces entreprises ont réalisé un chiffre d’affaires total de 780 millions d’euros, soit seulement 0,5% du chiffre d’affaires annuel total des entreprises marchandes non financières. En dégageant plus de 350 millions d’euros de valeur ajoutée, les ICC contribuent directement à plus de 0,8% du PIB national et à 1,8% de la valeur ajoutée totale générée par le secteur marchand non financier. Enfin, les ICC rassemblent 72,1% de l’emploi du secteur culturel, soit plus de 6 000 personnes[14], mais moins de 2% de l’emploi total.
Ces quelques données économiques montrent clairement que les Industries Culturelles et Créatives luxembourgeoises constituent aujourd’hui un secteur économique bien plus modeste que le poids qui lui est généralement attribué. Néanmoins, il est difficile de se satisfaire de quelques statistiques pour rendre compte de toute la diversité et de la vitalité des activités culturelles qui composent ce secteur. Seules des données et des analyses plus approfondies sont capables de montrer la capacité des ICC à générer de l’emploi, de la croissance et à être un facteur de diversification de l’économie nationale à travers le développement de clusters culturels et médiatiques.
Si les premières analyses de référence sur les ICC[15] n’ont pas pu être menées à leurs termes en raison de l’arrêt brutal de l’activité de la Cellule statistique du ministère de la Culture, d’autres doivent impérativement voir le jour car établir un état des lieux des activités économiques des ICC reste une condition essentielle à l’orientation et à l’évaluation de toute politique ministérielle en faveur des industries créatives, sous peine d’échouer à soutenir leur développement.
[1] http://paperjam.lu/news/les-industries-culturelles-sont-lavenir-du-luxembourg, Juillet 2010.
[2] Programme gouvernemental 2014, page 137.
[3] Résolutions culturelles. Idée du mois n°5, Fondation IDEA, 2014.
[4] ESSnet-Culture, http://ec.europa.eu/culture/library/reports/ess-net-report_en.pdf.
[5] A creativity policy for the culture: objectives, conditions and paradox. Philippe Chantepie, 2007.
[6] Libérer le potentiel des industries et créatives. Livre vert de la Commission européenne (COM (2010)183/3).
[7] La notion d’« Industries culturelles » est différente de la notion anglophone de « Cultural industries » qui est plus large et englobe également le patrimoine, les arts visuels et les arts du spectacle.
[8] La publicité est considérée comme une activité culturelle à travers son activité de conception qui fait appel à un potentiel de création artistique et culturelle. Les activités de marketing et de régies publicitaires ne sont pas considérées comme culturelles.
[9] D’après Eurostat, « entre 2008 et 2011, l’emploi dans les secteurs de la culture et de la création s’est révélé plus résistant que dans l’économie de l’Union dans son ensemble ».
[10] Libérer le potentiel des industries et créatives. Livre vert de la Commission européenne (COM (2010)183/3).
[11] Europe créative. Commission européenne, 2011
[12] TERA Consultants, 2010.
[13] http://epp.eurostat.ec.europa.eu, Structural Business Statistics (SBS).
[14] Cellule statistique – Ministère de la Culture, 2014.
[15] Programme statistique et d’études 2014 du ministère de la Culture, https://drive.google.com/open?id=0BgjLEVWJpHsREpRV3RoeHFmeWs

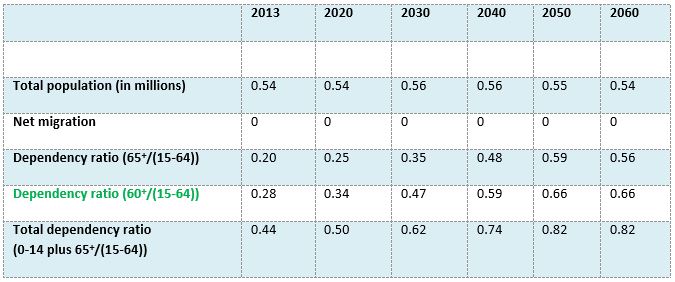 Source: Eurostat, Calculations IDEA
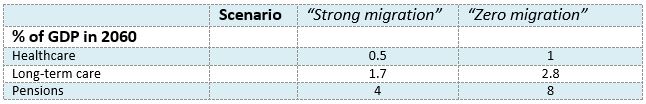 Source: Eurostat, Calculations IDEA.